Waypoint Smart Money · Sierra Chart study
Market Structure
Swing and internal structure: HH/HL/LH/LL points, BOS, CHoCH and MSS lines, and strong/weak highs and lows.
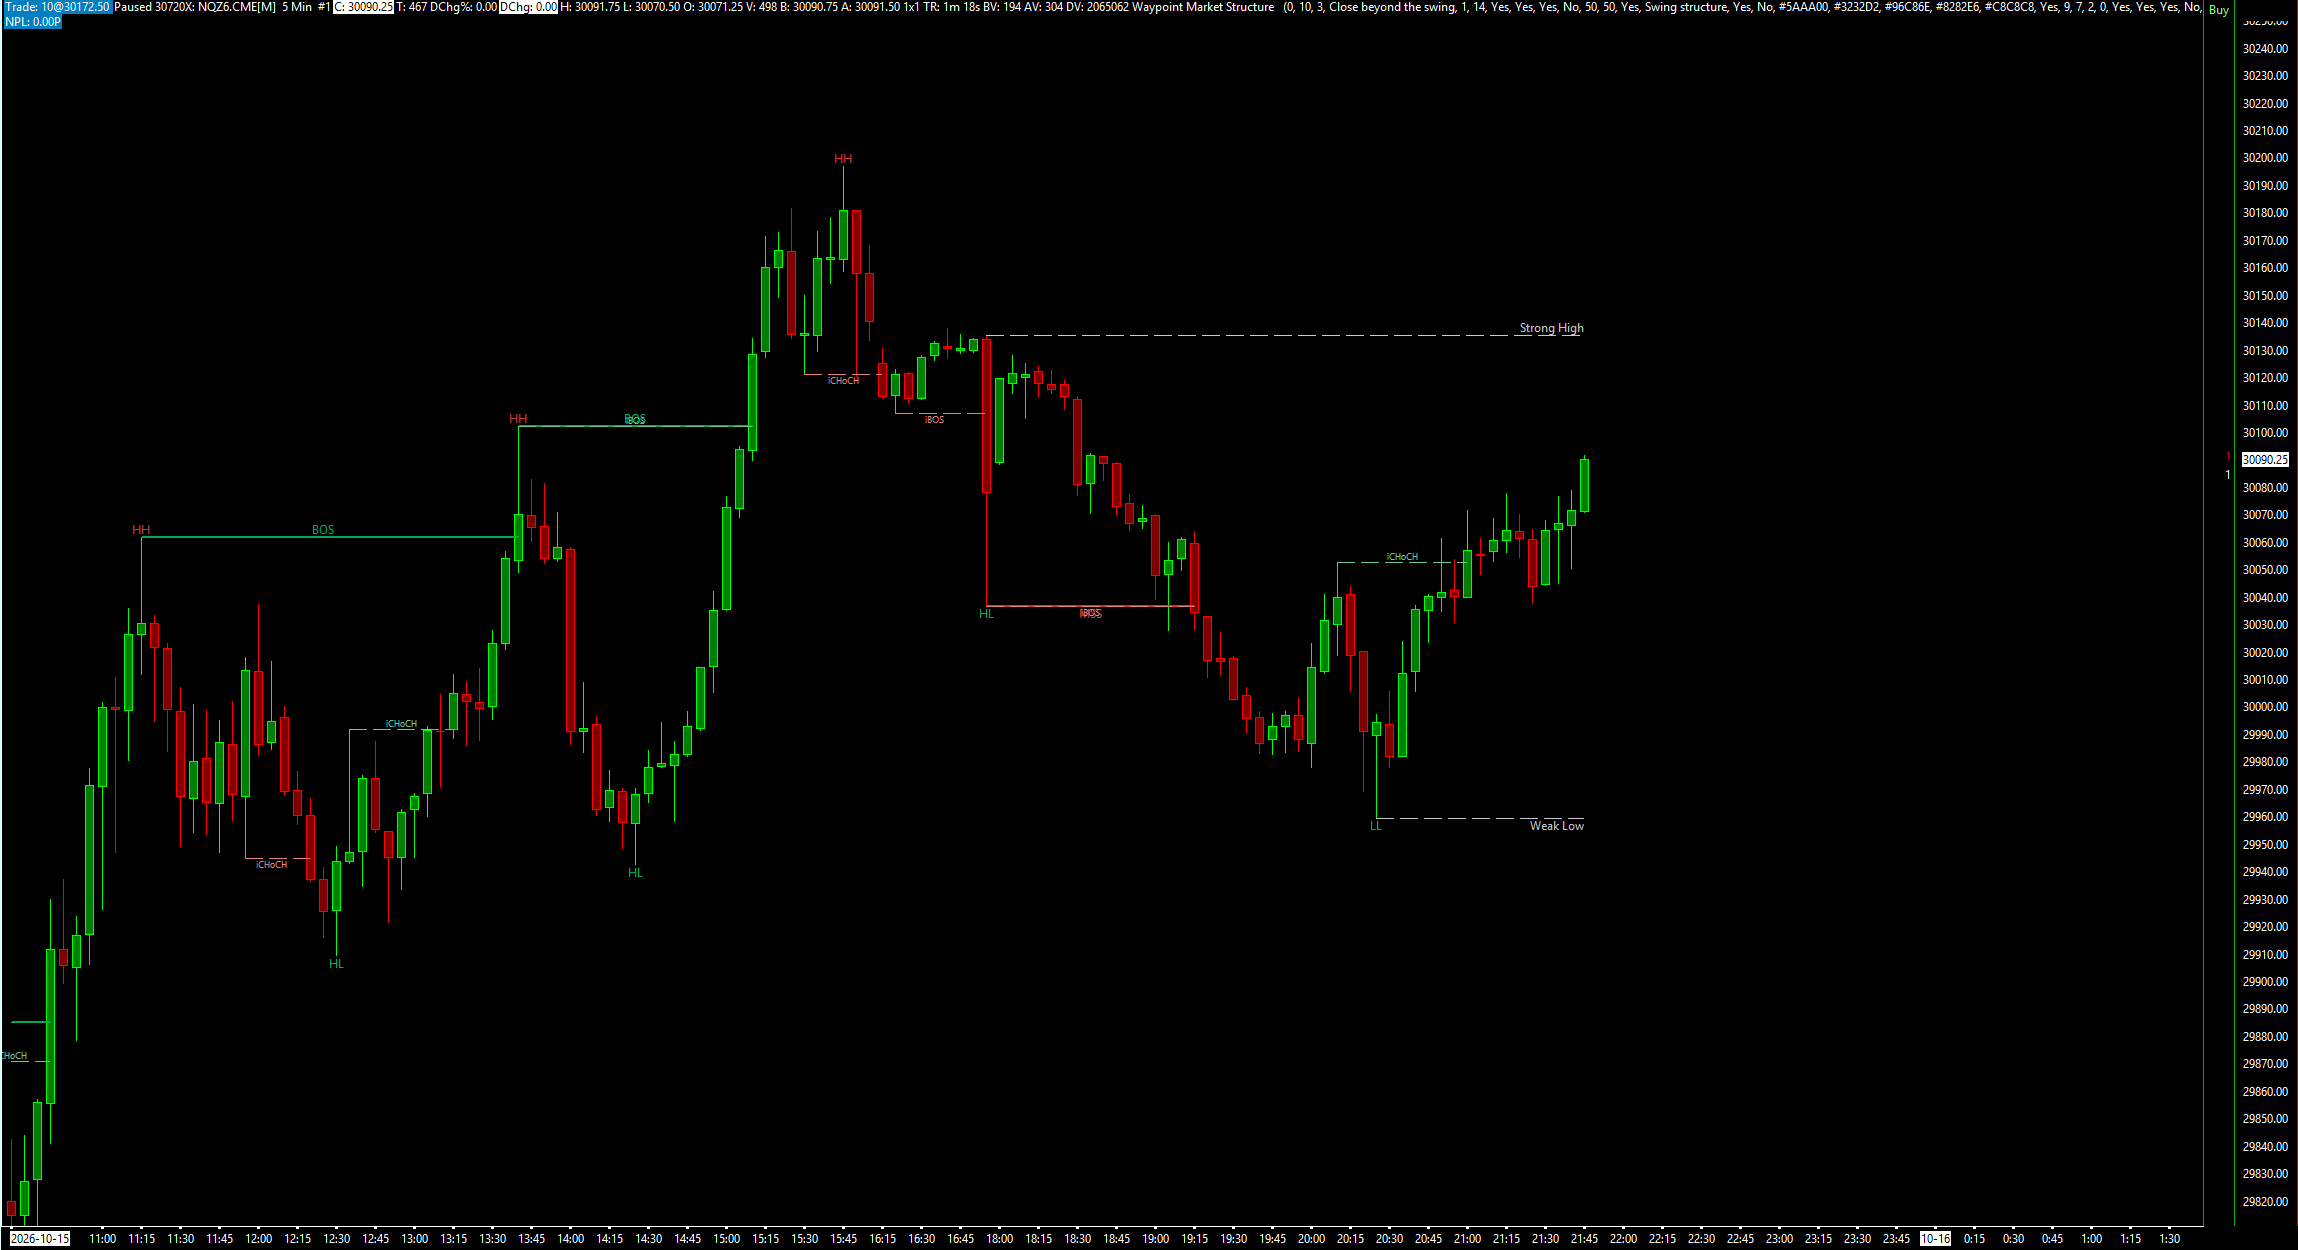
Market Structure draws swing highs and lows labelled HH, HL, LH and LL, and the breaks of structure between them, BOS, CHoCH and MSS, on two layers: swing and internal. It marks the strong and weak high and low, and can build the structure from a higher timeframe on the same chart. Every pivot and break is decided on closed bars, so nothing that has been drawn changes later. It draws and alerts; it places, changes and cancels no orders.
What the study does
- Two layers of structure: swing (pivot length 10) and internal (pivot length 3). Each layer's breaks and swing points can be switched on or off.
- Swing points labelled against the previous pivot on the same side: HH or LH for highs, HL or LL for lows, EQH or EQL on an exact tie, and H or L for the first one.
- BOS, CHoCH and MSS: a line from the broken swing to the bar that broke it, with a label. Swing breaks are solid; internal breaks are dashed and labelled iBOS, iCHoCH and iMSS.
- A break is confirmed by a close beyond the swing (default) or by a wick. An MSS is a CHoCH whose break bar has a body of at least MSS Displacement times the ATR (default 1.0).
- Strong and weak high and low. In a bullish trend the Strong Low is the protected low of the last break and the Weak High is the level the next BOS would take; a bearish trend mirrors them. Lines extend to the last bar, or show as labels only.
- Structure Timeframe in Minutes builds the structure from a higher timeframe on the same chart, for example 15 on a 1-minute chart, or 1440 for the Globex day.
- No repainting: pivots, breaks and labels form on closed bars only. An optional dotted "BOS?" line shows a break on the forming bar, worked out on a copy so it never changes the committed structure.
- Alerts on a break, with separate switches for BOS, CHoCH and MSS and for internal breaks. Each alert fires once, on the close of the break bar.
- 22 hidden subgraphs, 11 per layer: trend, break, BOS, CHoCH and MSS flags, the last swing high and low, the unbroken levels a break must take, and the protected high and low.
What you need
- Any intraday chart. For the Structure Timeframe input, a bar size that divides the timeframe, such as 1-minute bars for 15-minute structure.
- A back-adjusted continuous contract for long history, so a roll is not read as a swing or a break.
Set it up in Sierra Chart
Step 1: Buy and download
Buy this study on its own here, or all eight Waypoint Smart Money studies at once from the Smart Money page (one .zip with every DLL). Checkout is a one-time payment. As soon as it is confirmed, the page Stripe returns you to has a Download button, and the receipt email carries the same link. Extract the .zip to any folder. It holds WaypointMarketStructure_64.dll, plus a short INSTALL.txt.
Step 2: Unblock the DLL
Right-click WaypointMarketStructure_64.dll > Properties. If the General tab shows an "Unblock" box, tick it, then click OK. Windows' Smart App Control can still refuse an unsigned DLL. If it does, the study is missing from the Add Custom Study list, or Sierra Chart's Message Log shows a loading error with the code 4551. Turning Smart App Control off is your own decision.
Step 3: Copy it into Sierra Chart's Data folder
Copy WaypointMarketStructure_64.dll into Sierra Chart's Data folder. On a default install that is C:\SierraChart\Data. Otherwise it is the Data folder inside wherever Sierra Chart is installed.
Step 4: Add the study to a chart
Open the chart, then Analysis >> Studies >> Add Custom Study. Find the group "Waypoint Market Structure", select "Waypoint Market Structure", click Add, then OK. If the group is not in the list, restart Sierra Chart and look again.
Step 5: Pick the structure timeframe
Open the study's Settings. Leave Structure Timeframe in Minutes at 0 to use the chart's own bars, or set a higher timeframe, for example 15 on a 1-minute chart. The periods are pieces of the Globex day, 18:00 to 18:00 New York, counted from 18:00, and 1440 is the whole Globex day. The study converts bar times to New York itself (New York Time From, default the built-in New York DST rules), so the periods are the same on a chart in any time zone. At 0 no times are used.
Step 6: Choose your rules
Set Break Confirmed By to a close beyond the swing (default) or a wick beyond it, and set the swing and internal pivot lengths (default 10 and 3). MSS Displacement (break-bar body, x ATR) sets how large the break bar's body must be for a CHoCH to count as an MSS.
Step 7: Read the chart
Swing breaks are solid lines labelled BOS, CHoCH or MSS; internal breaks are dashed and labelled iBOS, iCHoCH or iMSS. A swing label appears Swing Pivot Length bars after its pivot, when the pivot is confirmed. In a bullish trend the Strong Low is the protected low and the Weak High is the next level a BOS would take; in a bearish trend they are mirrored. This study has no panel.
Step 8: Check that it loaded
Open Window >> Message Log. Look for a line that starts with "Waypoint Market Structure BUILD", followed by the build date and time. That line proves the study loaded. It also gives the pivot, BOS, CHoCH and MSS counts for each layer. With a Structure Timeframe set, a second line, "Waypoint Market Structure time check", says whether Sierra Chart's time-zone conversion and the built-in New York rules agree; if they do not, it is logged as an error.
Settings to check first
Open them with a right-click on the chart, then Studies, select the study and press Settings.
- Structure Timeframe in Minutes (0 = chart bars, 1440 = daily)
- Builds the structure from a higher timeframe on the same chart. 1440 is the Globex day from 18:00 New York. Default 0 (chart bars).
- Swing Pivot Length (bars each side)
- Bars each side of a swing pivot. Default 10. A swing is confirmed that many bars after it.
- Internal Pivot Length (bars each side)
- Bars each side of an internal pivot. Default 3.
- Break Confirmed By
- Close beyond the swing (default), or Wick beyond the swing.
- MSS Displacement (break-bar body, x ATR)
- The break bar's body a CHoCH needs to count as an MSS. Default 1.0, with ATR Length 14.
- Show Internal Points (HH/HL/LH/LL)
- Labels the internal layer's swing points. Default No; internal breaks are shown by default.
- Show Strong / Weak High and Low
- Draws the strong and weak high and low. Default Yes, from Swing structure, with the lines extended right.
- Alert Sound Number on a Break (0 = off)
- The alert sound for breaks. Default 0 (off). Alert on BOS, CHoCH and MSS default to Yes; Alerts Include Internal Structure defaults to No.
Good to know
- A charting and context tool, not a signal service. It labels structure; it makes no claim that a break forecasts price.
- Smart-money terms vary between teachers. The study uses one fixed set of written rules, with the main choices as inputs.
- A swing label appears Swing Pivot Length bars after its pivot, when the pivot is confirmed. A newer swing on the same side replaces the tracked level, even if the old one was never broken.
- With a Structure Timeframe set, a period's breaks show when the first chart bar of the next period appears, and are drawn on the period's last chart bar.
- On an unadjusted continuous contract, each roll is a price jump that the study reads as real swings and breaks.
- Only the most recent swing points and breaks are drawn: 50 per layer by default, 150 at most.
- It draws and alerts. It places, changes and cancels no orders.
How it was tested. The engine was compiled exactly as shipped and compared pivot by pivot and break by break with an independent reference on years of NQ, ES and CL 1-minute data, on chart bars, native 15-, 60- and 240-minute bars and the timeframe input, with close and wick breaks. The forming-bar copy was checked against the committed result on every bar, and planted bugs were caught.
More Waypoint Smart Money studies
$9.99
Fair Value Gaps
Fair value gaps with fill tracking, CE lines, inversions and BPRs, plus a scorecard against random levels.
$9.99
Order Blocks
Order blocks and breaker blocks from structure breaks, on any timeframe, scored against random levels.
$9.99
Liquidity
Buy-side and sell-side liquidity pools, with every sweep marked as a raid or a run.
$9.99
One-time, instant download
Trade an idea around these levels?
Screen it first. Describe the rule in plain English and it is tested on tick data through pre-registered gates, after costs, with every trial counted in the public ledger.